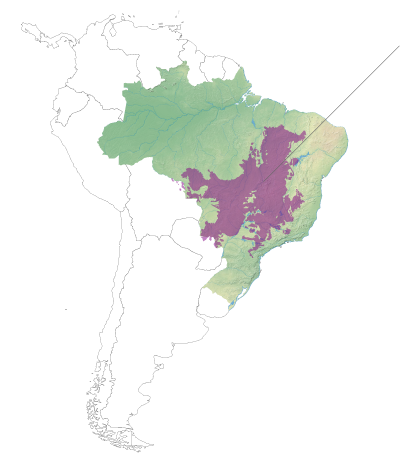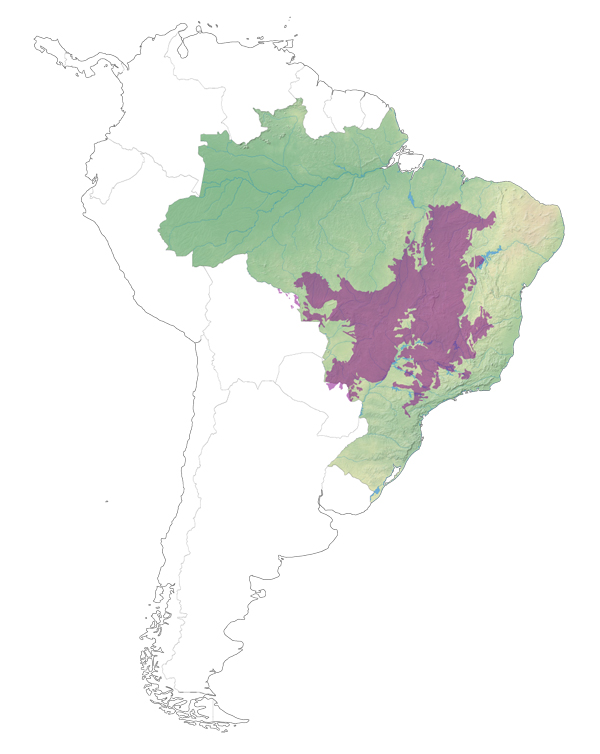
The SCF’s work focuses on 61 municipalities in the Cerrado biome that accounted for 25.9% of all soy planted there in the 2021/2022 crop year. Since the 2020/21 crop year, the total soy area in our 61 focus municipalities increased by 5.7% across the Cerrado. This compares to a 7.4% increase in soy area in the same time frame the previous year. The comparatively low rate of soy expansion among our focus municipalities compared to the Cerrado indicates that they are not the leading contributors to total soy expansion.
Still, the direct conversion of native vegetation to soy intensified in the focus municipalities during crop year 2021/22 – from 18,023 hectares in 2020 to 32,257 hectares in 2021. This direct conversion of native vegetation to soy, as opposed to total lands transitioning from any purpose to soy production, presents the greatest threat to irreplaceable biodiversity and ecosystem service loss. Our collaborative work seeks to address and prevent these losses through the protection of native vegetation while promoting sustainable soy cultivation.


